Eliminate complexity, align KPIs, and empower smarter decisions with visually compelling dashboards that deliver measurable results in as little as 30 days—guaranteed.


Interconnected data across businesses, systems and people, all separate, disparate and unimaginably complex. Soon to be fully integrated, accelerated, automated and even MORE complex. All the high-yield data for your business…will live & breathe at the interface.
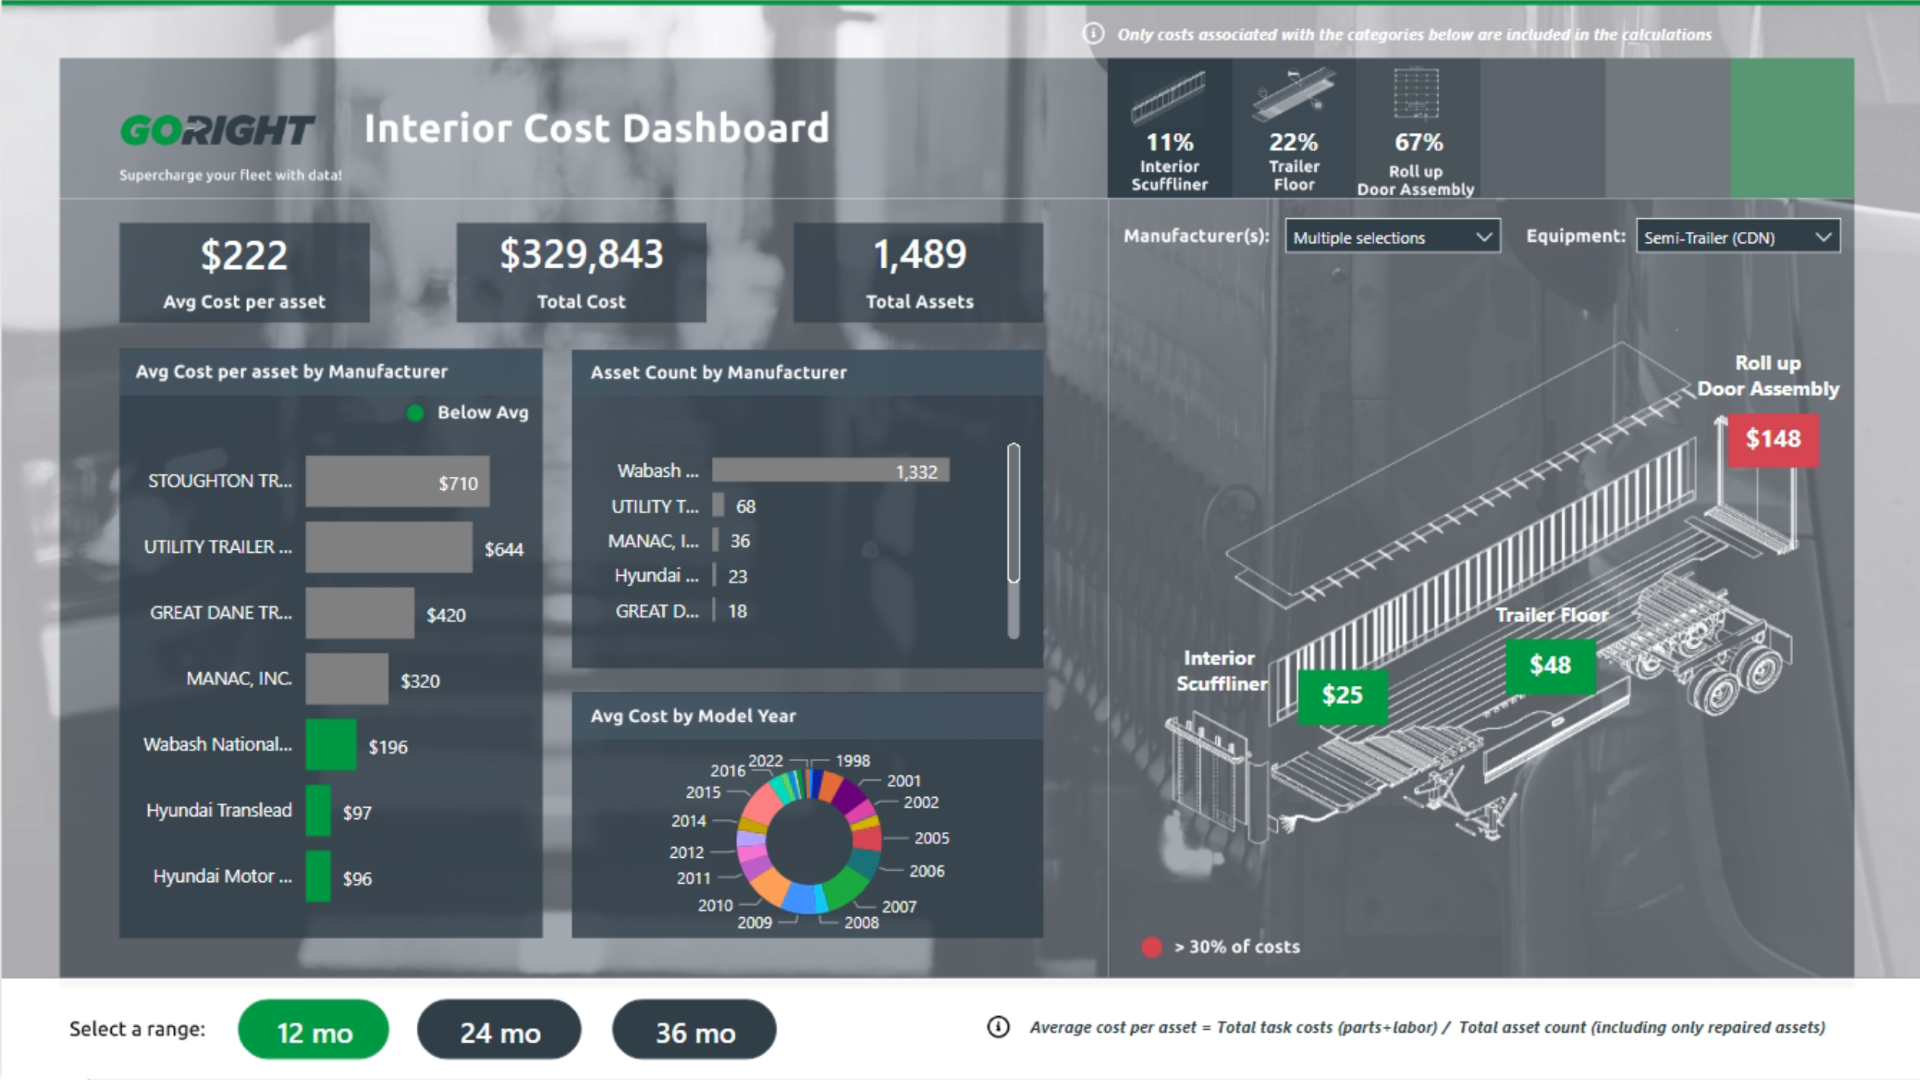
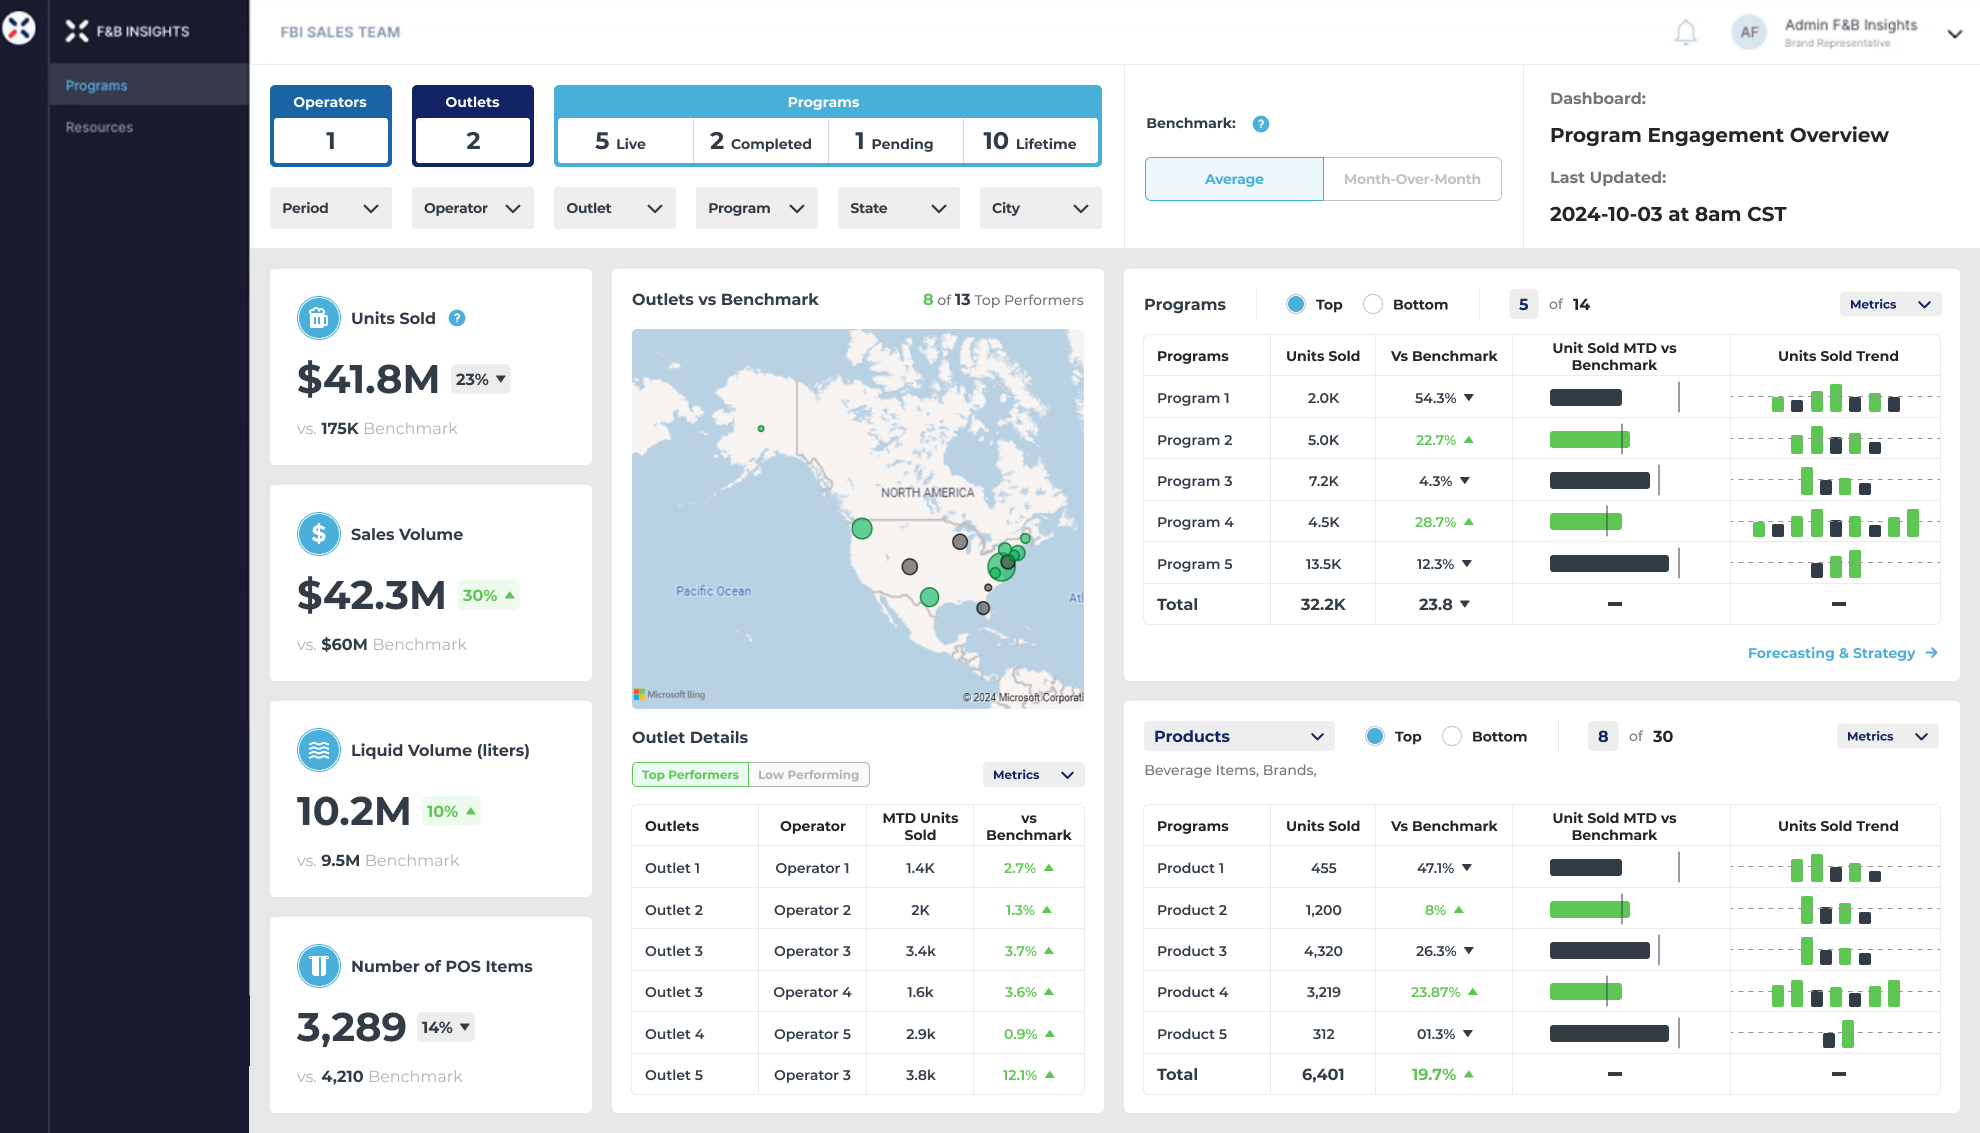
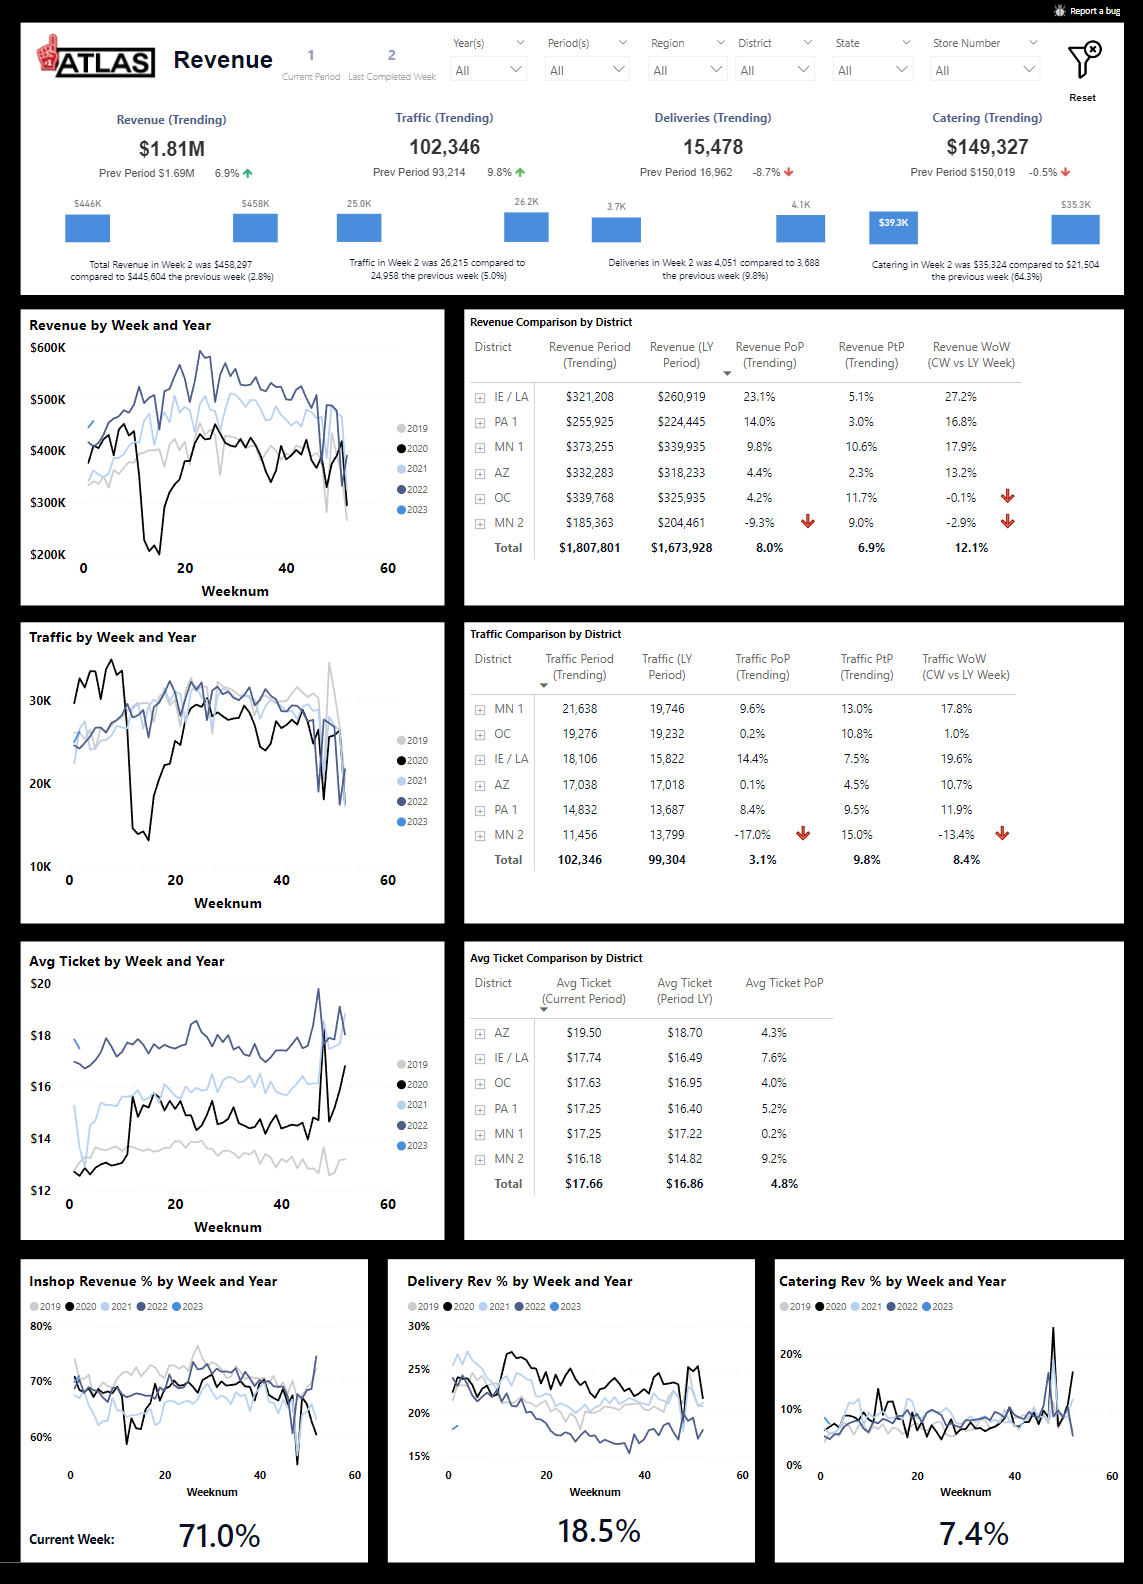
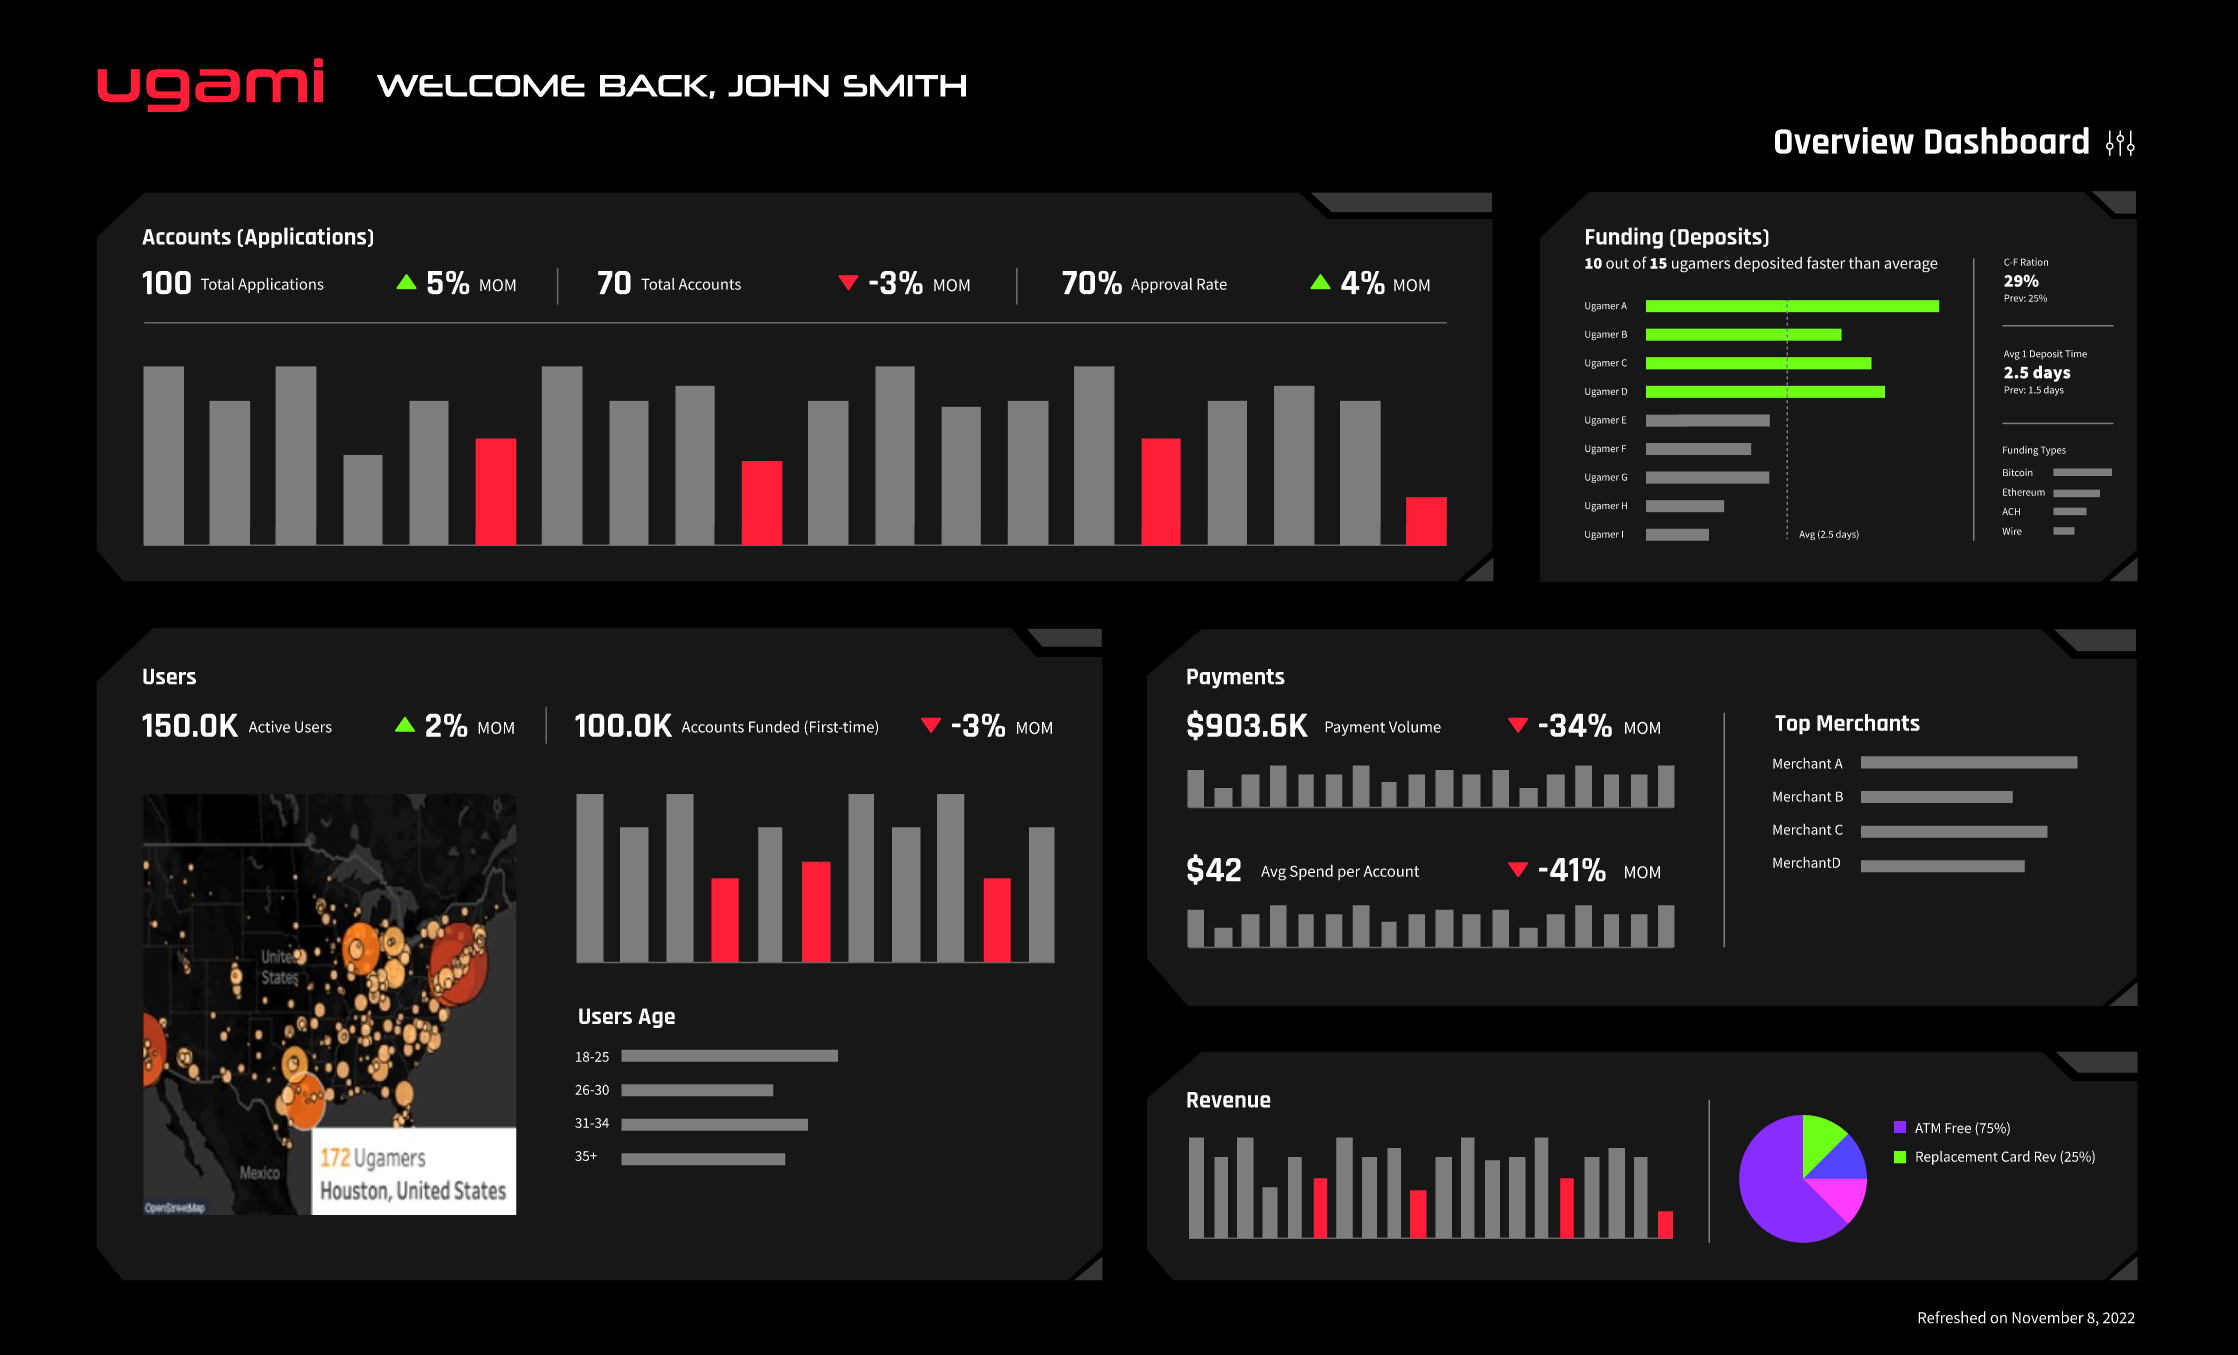
Relieving serious data pain for serious ROI gains—see how we help our clients turn complex data into real-time insights and fast, high-impact decisions.

Technology
By implementing comprehensive data infrastructure and actionable Power BI dashboards, Microsoft enhanced app usage and retention, optimizing decision-making for their Career Coach product launch.
Read More

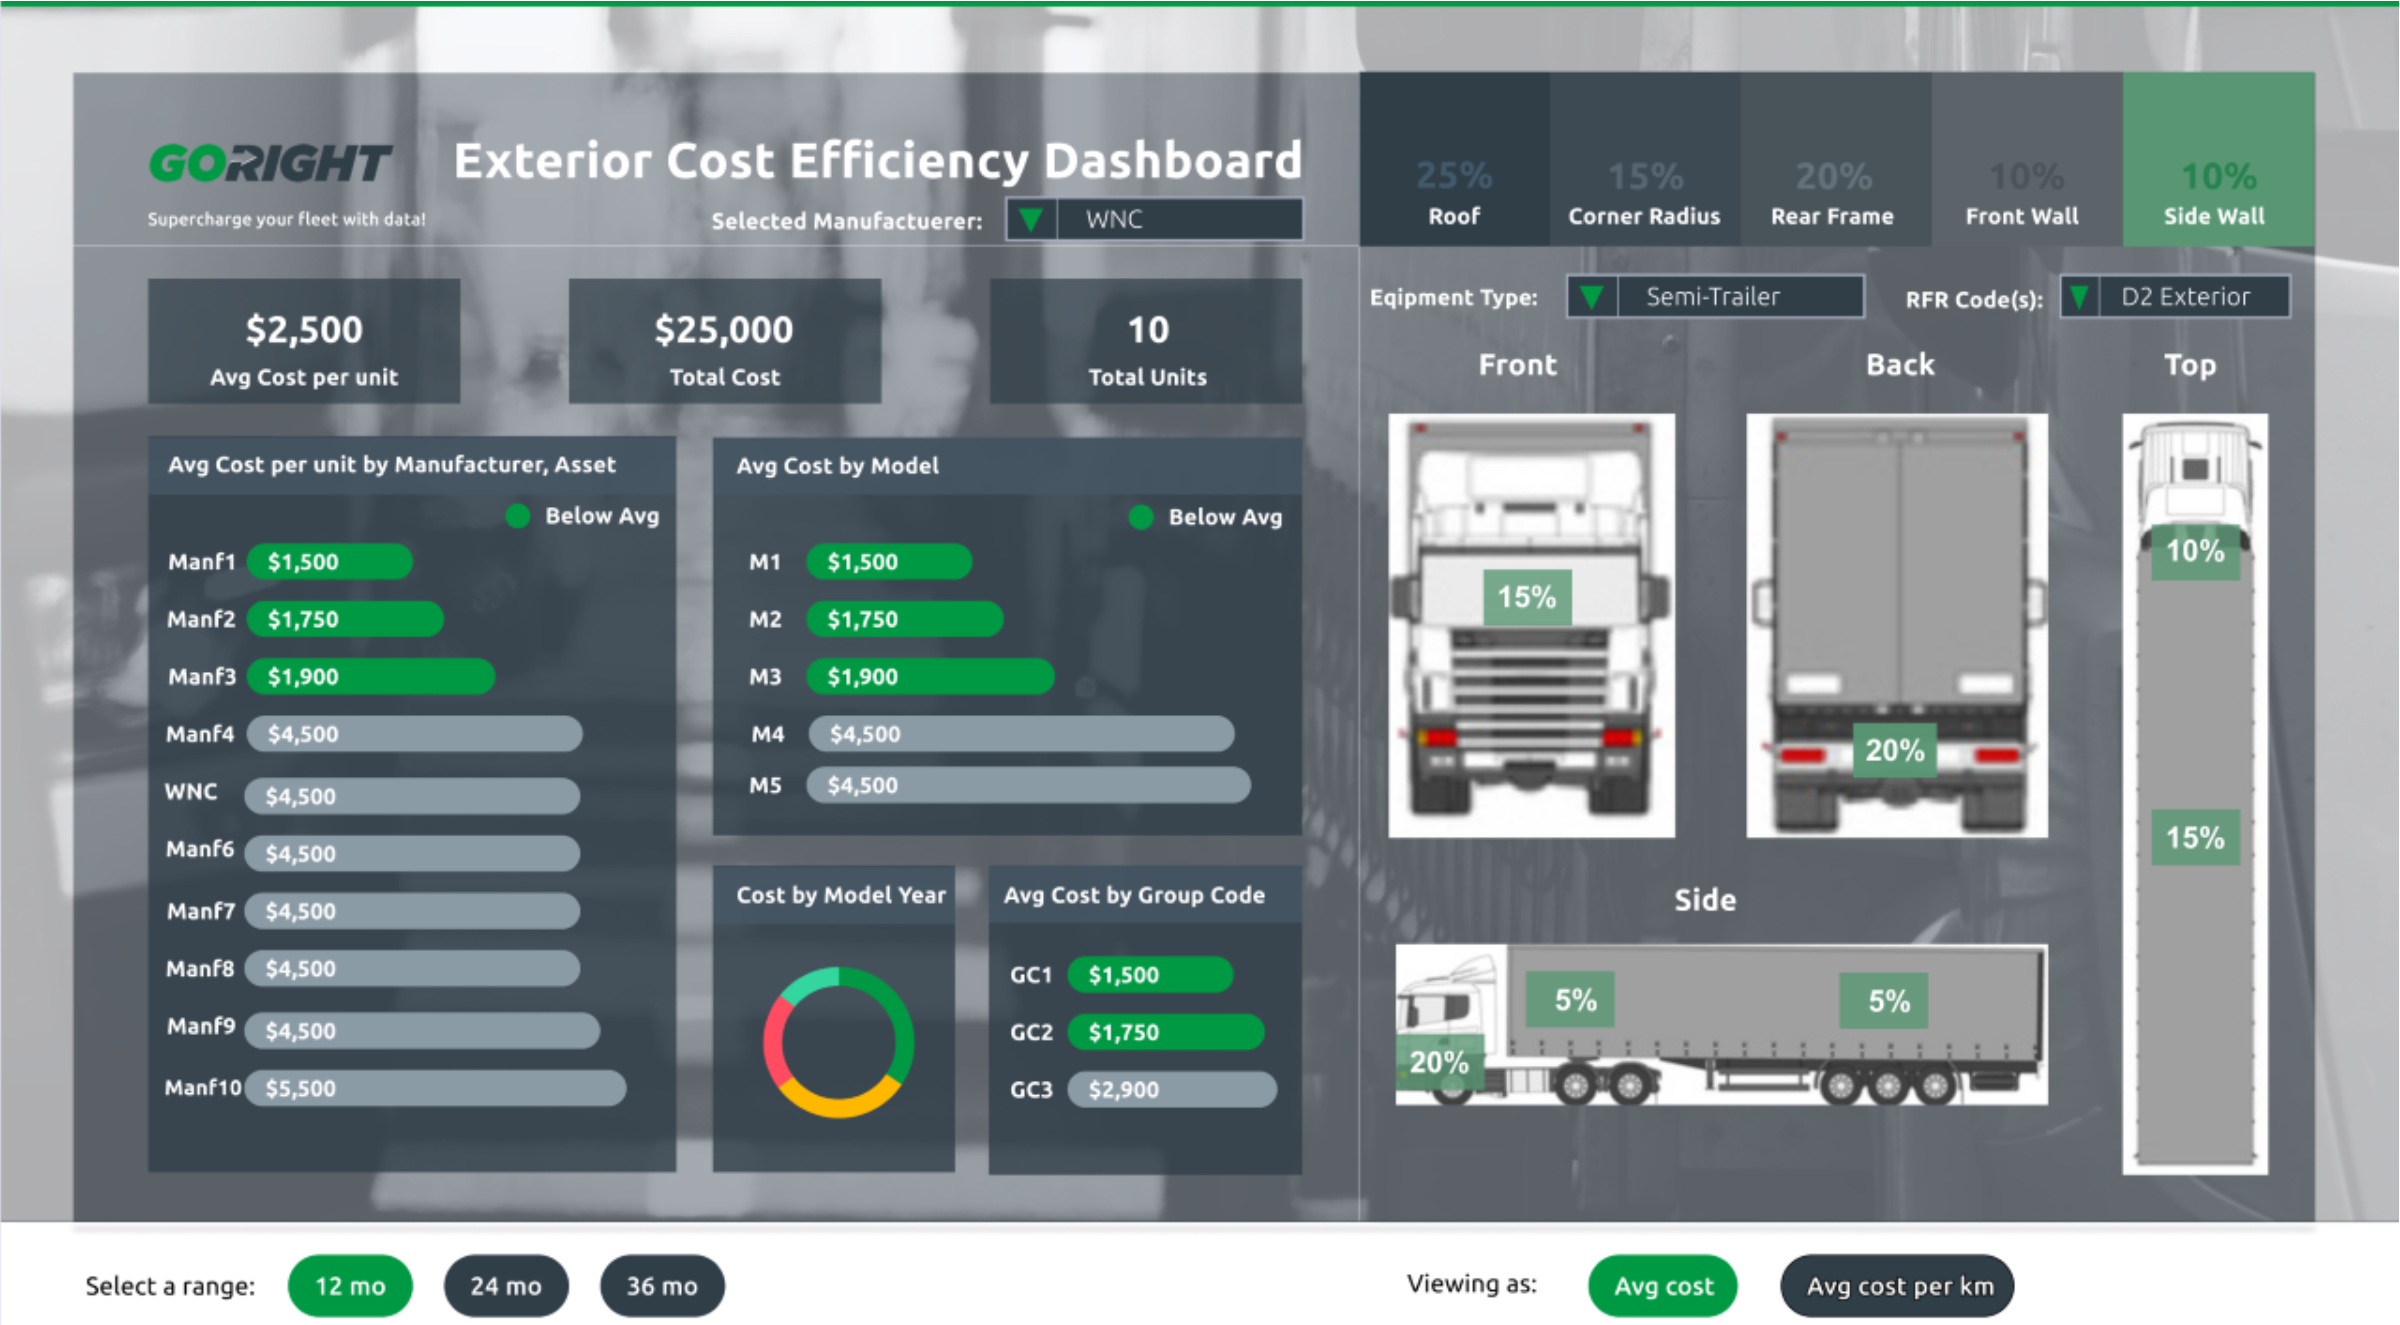
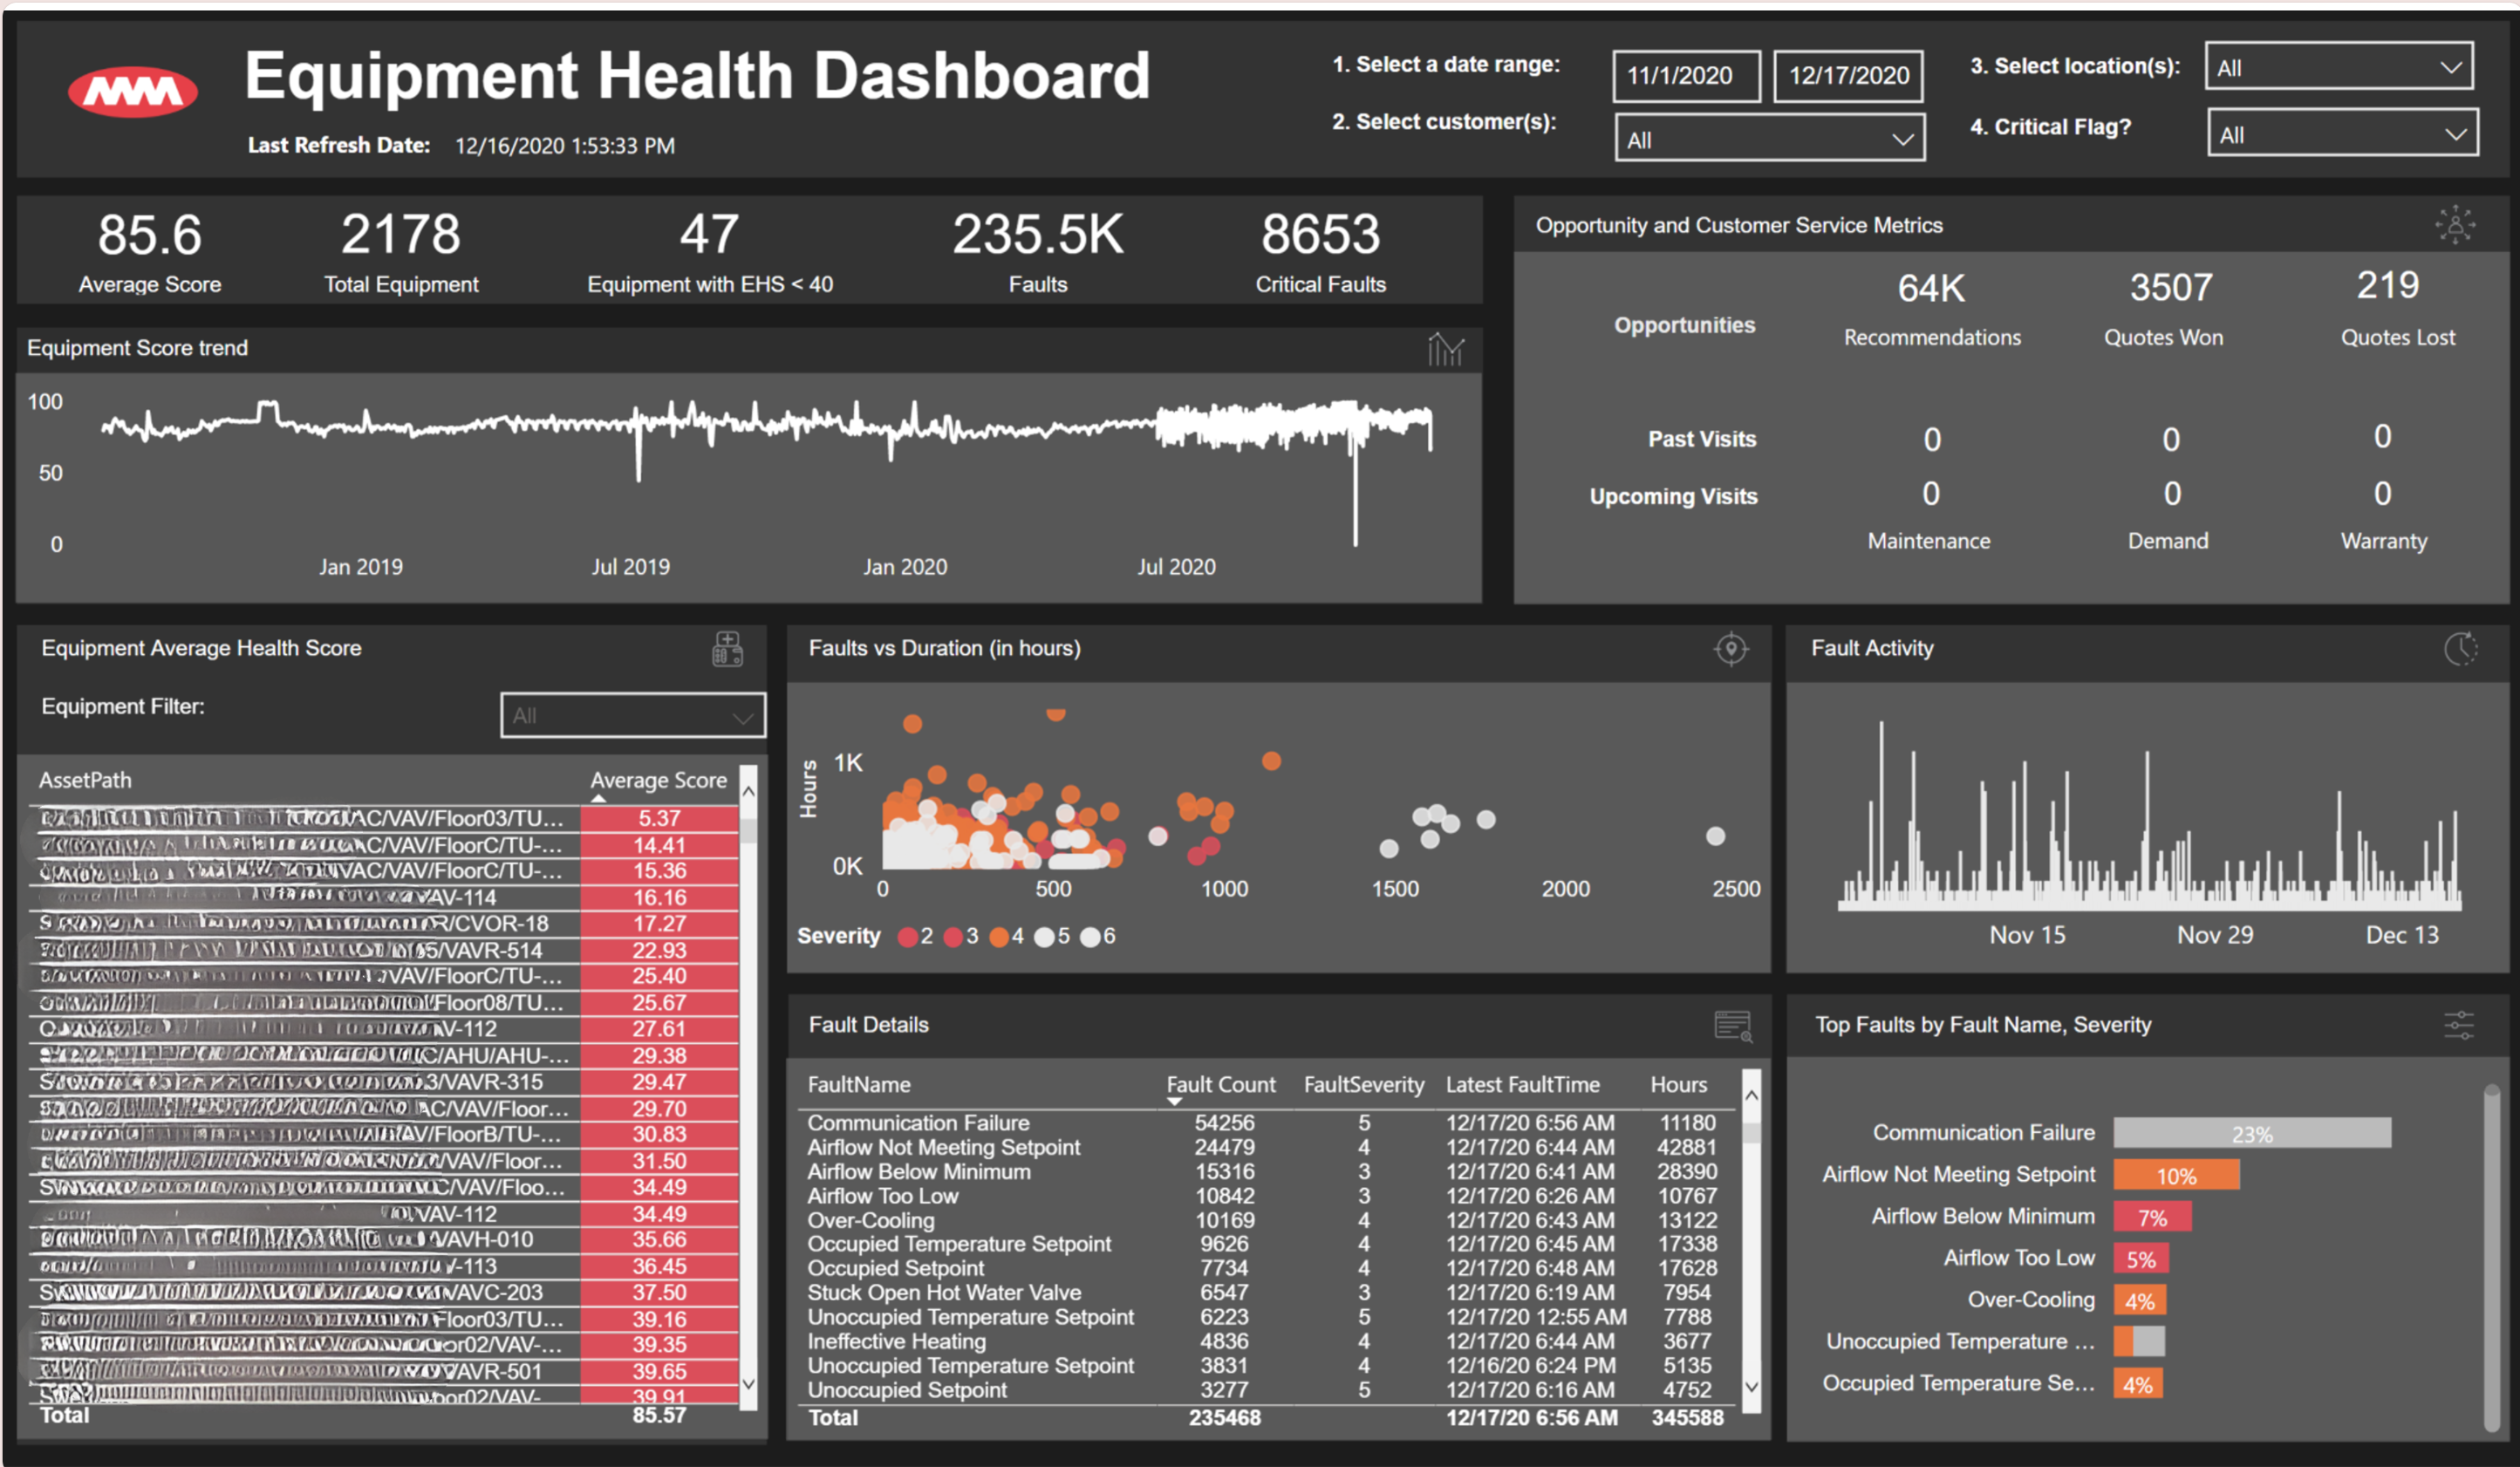
Construction
By leveraging tailored Power BI solutions and Azure data services, MacDonald-Miller enhanced operational efficiency and reduced system faults, revolutionizing energy management and HVAC optimization.
Read More

Consumer Goods and Retail
The Millard Analytics Portal significantly improved operational efficiency and profitability through innovative data solutions, saving time and enhancing decision-making processes.
Read More

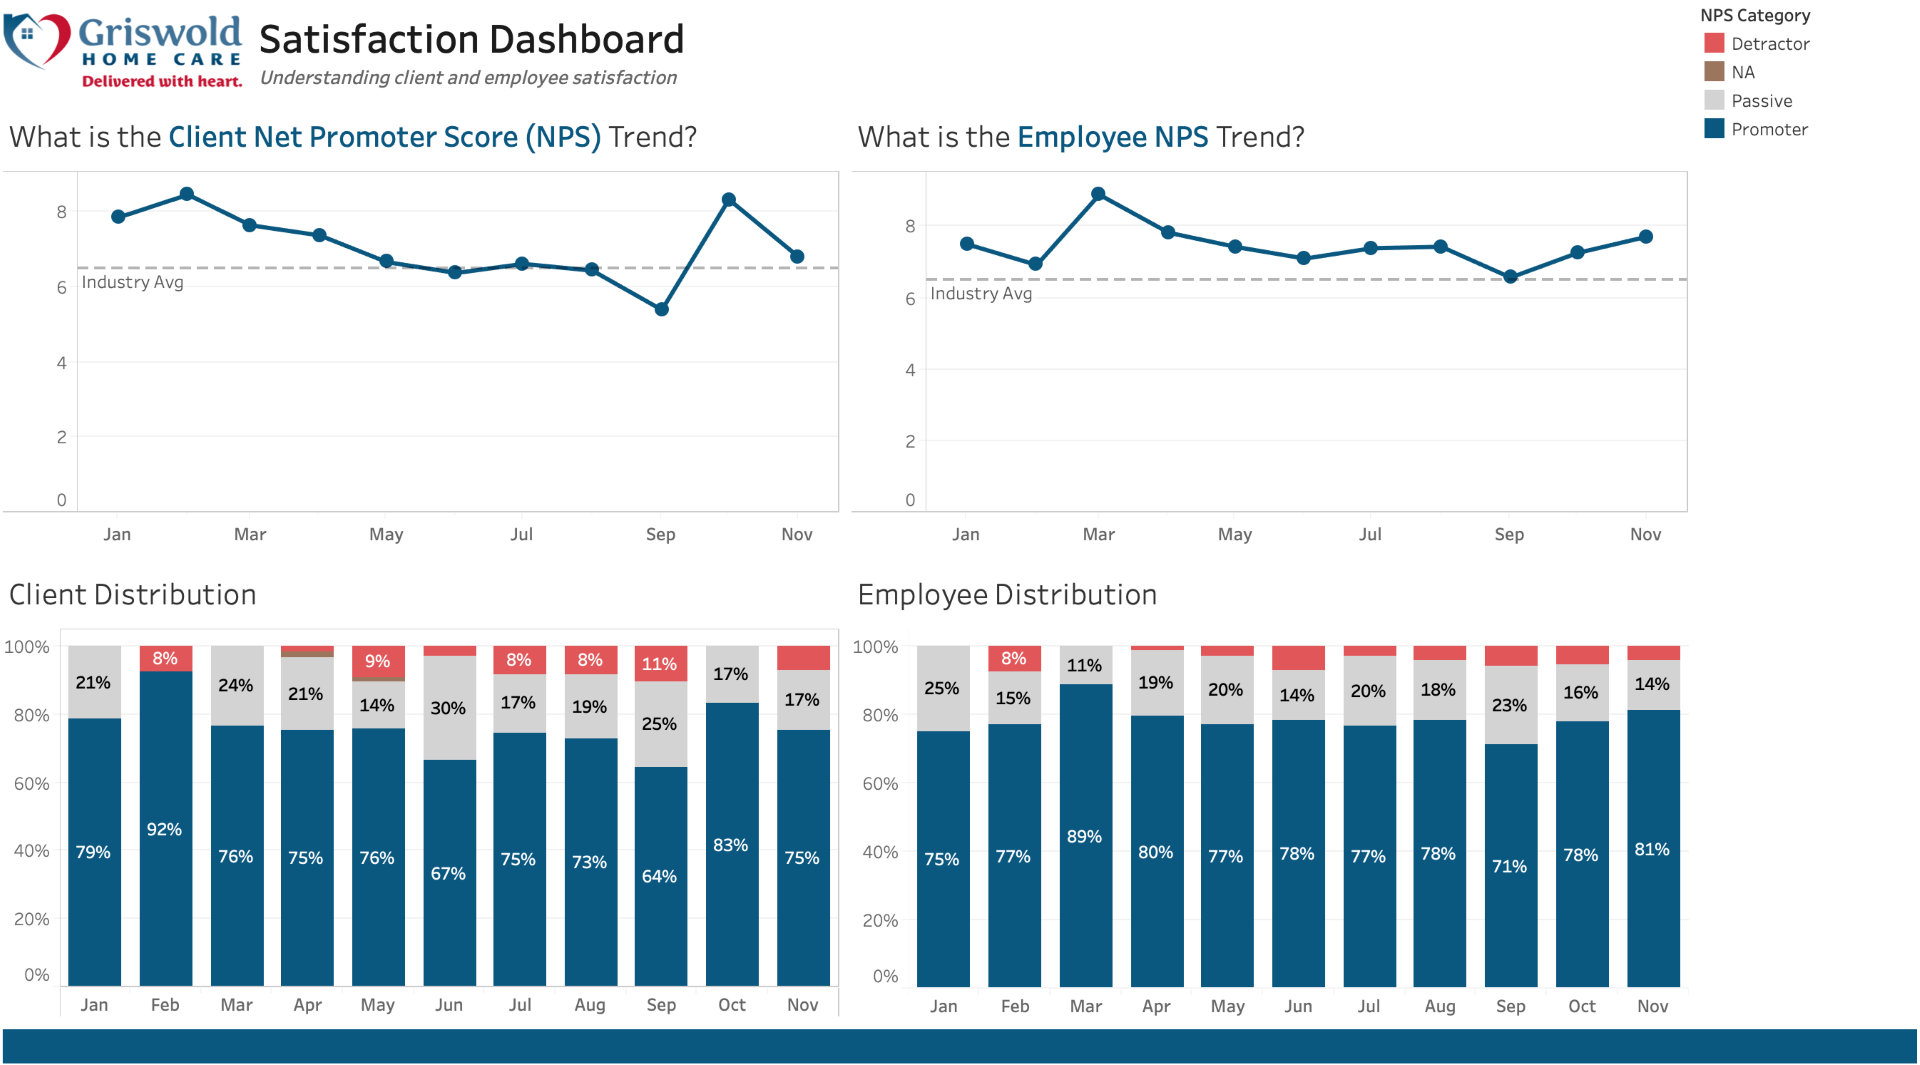
Healthcare
By deploying intuitive Power BI dashboards and advanced analytics, Edwards Life Sciences improved clinical site efficiency and reduced trial risks, transforming clinical trial management.
Read More


From back-end architecture (SQL, Azure, GCP, AWS, Python, APIs) to front-end visualizations (Power BI, Tableau), we provide seamless, fully integrated data solutions that unlock actionable insights across your organization.

Your business is unique, and so are your challenges. Our proven process—Discover, Design, Develop—ensures we understand your needs and deliver custom dashboards tailored specifically to you.


Time is everything. Imagine getting the insights you need at the moment you need them—no delays, no confusion.

Imagine a dashboard where every design element—Flow, Integrity, Color, Typeface, and Charm—works together to give you instant clarity. No more sifting through data; you’ll find exactly what you need, when you need it, making informed decisions in seconds.

Your business has unique needs, and your data solution should reflect that. Whether it’s AI integration, advanced security, or custom reporting, we tailor everything to fit your vision. With a solution built just for you, reaching your goals becomes easier than ever.

As your business grows, so do your data needs. Our solutions are designed to grow with you, providing the flexibility and scalability required to keep you agile and ready for whatever the future holds. You’ll never outgrow your data systems.


North Star: Empowering organizations to achieve executive clarity and confidence in every decision by transforming complex data into visually compelling data experiences.
“Spark was born from a simple realization: too many organizations are drowning in outdated, scattered data.
When I began my career in data analytics, I saw executives relying on dozens of Excel sheets and pivot tables—tools that couldn’t keep up with real-time demands or spark the “aha” moments that drive action. With a background in design and a love for tech, I created Spark Intel to bring clarity to complexity, merging art and data into intuitive, visually compelling dashboards that transform the interface between data and decision-making.
At Spark Intel, we help you Centralize, Optimize, and Accelerate your data, turning it into powerful assets that fuels strategic growth and boosts your bottom line.
For leaders ready to eliminate guesswork, achieve faster results, and visualize your future, Spark is here to be the interface that redefines your data experience.”
Empower your business with knowledge from industry leaders. Access expert-driven content that simplifies data complexities and provides actionable insights for growth.

From AI advancements to data governance tips, our blogs deliver practical insights to elevate your decision-making.
Read More

Learn how our clients leverage Spark Intel solutions for smarter decisions and sustained growth.
Read More
Subscribe for our latest designs, videos, webinars, blogs, and guides.